
What is T12 in Real Estate?
T12 in real estate stands for “Trailing 12 Months,” a breakdown of a property’s income and expenses over the past twelve months. It is a financial document used to analyze the financial performance of income-producing properties.
To calculate T12, sum up the income and expenses over the previous 12 months. Then subtract the total expenses from the total income, which will generate your net income. The resulting T12 will tell you about the property’s ability to generate revenue, manage expenses, and yield potential returns on investment.
Purpose of T12 in Real Estate
The T12 real estate report serves as a powerful tool for both seasoned investors and newcomers to the real estate market.
- Investors use T12 to get an overview of a property’s financial performance, offering valuable insights into its revenue, expenses, and overall profitability.
- Lenders perform T12 analysis to aid them in making informed decisions when extending loans or financing.
Difference between TTM and LLM
When it comes to evaluating a property’s financial performance, terms like T12, TTM, and LLM often come into play. These acronyms represent different timeframes used to assess a property’s income and expenses.
- T12 (Trailing 12 Months): T12 provides a snapshot of a property’s financial performance over the most recent twelve months. It captures the property’s income and expenses during this period, offering a current overview.
- TTM (Trailing Twelve Months): TTM also covers twelve months, but it’s a rolling period that updates each month. This ongoing time frame allows for more up-to-date insights as it adjusts over time.
- LLM (Last Twelve Months): LLM refers to a fixed twelve-month period that remains static. Unlike TTM, it doesn’t adjust with time, potentially missing recent market changes.
In this guide, we’ll focus on T12 and its significance in real estate analysis, helping you navigate the complexities of property evaluation.
What Does a T12 Look Like? What does it include?
Let’s take a closer look at what a T12 report actually encompasses and the key components it includes.
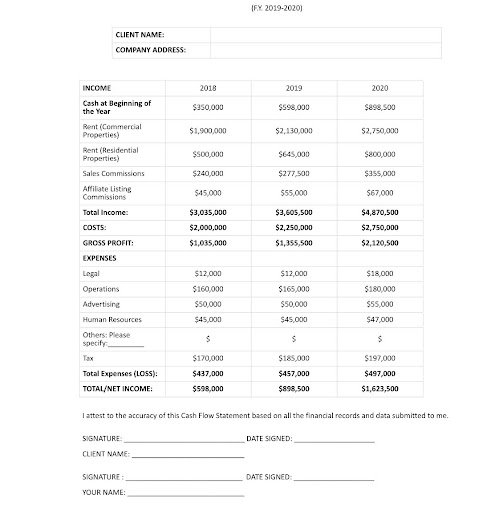
A structured T12 will highlight your income and expenses over the past 12 months. Subtracting the total expenses from the total income will generate your net income.
Income and Revenue Components
One of the central aspects of a T12 report is the property’s income. This includes all revenue streams generated by the property, such as rental income from tenants, proceeds from leasing, and any additional sources of income like parking fees or common area charges.
Accurately capturing these revenue streams provides a clear overview of the property’s income-generating potential
Expense Breakdown
Equally important are the expenses associated with the property’s operation. These expenses encompass a wide range of costs, from property management fees and maintenance to utilities and property taxes.
The T12 report itemizes these costs, offering a comprehensive view of the financial obligations tied to the property’s upkeep and management.
Accuracy of Records and Data
For a T12 report to be truly effective, the accuracy of the records is paramount. This includes ensuring that all income sources and expenses are accounted for, leaving no gaps in the financial overview.
Accurate and complete data is essential for both internal evaluation by property owners and external assessment by potential investors, lenders, or stakeholders.
Regular Updating and Seasonal Adjustments
Incorporating the TTM method, the T12 report adapts to the changing nature of the real estate market. Regular updates ensure that the most recent financial data is considered, allowing investors and analysts to make well-informed decisions.
Additionally, seasonal adjustments account for any fluctuations in income or expenses that may be influenced by external factors.
How Does T12 Support Investment Decisions?
Investors, lenders, and stakeholders use the T12 report to assess the property’s ability to generate consistent revenue, cover operational costs, and potentially yield profitable returns.
By analyzing the T12 report, individuals can make informed investment decisions and gauge the property’s potential contribution to their portfolios.
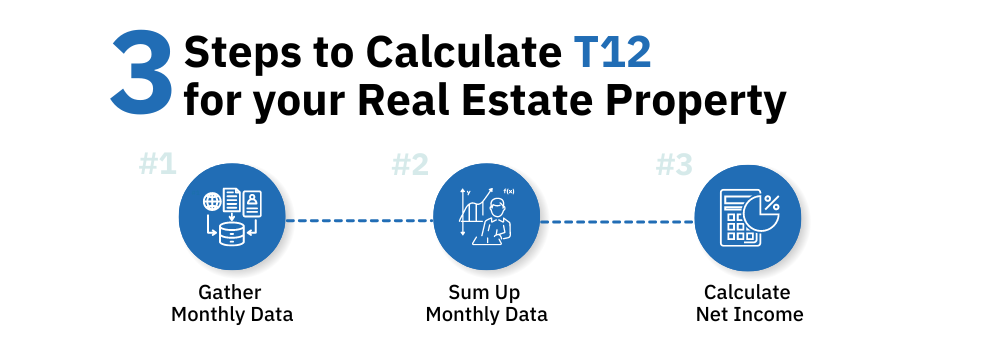
How to Calculate Trailing Twelve Months (T12) for your Real Estate Property?
To calculate T12, sum up the income and expenses over the previous 12 months. Then subtract the total expenses from the total income, which will yield your net income.
The resulting T12 will tell you about the property’s ability to generate revenue, manage expenses, and yield potential returns on investment.
Step #1: Gather Monthly Data
Begin by collecting the monthly data for both income and expenses related to your property, over the past 12 months.
Make sure to include rental income, leasing proceeds, property management fees, maintenance expenses, utilities, property taxes, and any other relevant financial transactions.
Step #2: Sum Up Monthly Data
Once you have the monthly data, sum up the income and expenses for each month to calculate the total income and total expenses over the twelve months.
Step #3: Calculate Net Income
With the total income and total expenses in hand, calculate the net income by subtracting the total expenses from the total income.
This net income figure represents the income generated by your property after covering all operational costs.
Step #4: Analyze the T12 Report
The resulting T12 report will offer you an insight into the property’s ability to generate revenue, manage expenses, and yield potential returns on investment.
Investors, lenders, and stakeholders rely on this report to make informed decisions about the property’s viability.
Conclusion
Whether you’re a property owner, investor, lender, or stakeholder, the insights garnered from T12 reports empower you to shape a more prosperous real estate future.
A manual way of calculating T12 for real estate can be a tedious task as it contains large amounts of data. Automate it using KlearStack, a document processing solution that can provide you with insights at your fingertips.
Get a detailed snapshot of your investment decisions and real-estate financial performance through T12 report generation, with 99% accuracy. Start your free trial today!

FAQs for T12 in Real Estate
T12 refers to “Trailing Twelve Months,” a financial metric that shows a property’s income and expenses over the previous year, aiding in real estate analysis.
A T12 report encompasses a property’s income sources, like rent, and expenses, including management fees, utilities, and taxes, over the past twelve months.
Trailing 12 months (TTM) represents the most recent twelve-month period for assessing financial data, offering insights into a property’s performance.
Calculate T12 by summing up income and expense data over the last twelve months, then subtracting expenses from income to determine net income.
TTM is calculated by considering the most recent twelve-month period from the current date. It’s a rolling timeframe that updates monthly.
TTM stands for “Trailing Twelve Months,” representing a moving twelve-month period for evaluating financial data.
A high TTM indicates strong financial performance over the past year, suggesting a property’s ability to generate consistent income and manage expenses effectively.
The key difference lies in the timeframe they cover. TTM (Trailing Twelve Months) is a rolling, continuously updating twelve-month period, providing up-to-date insights. T12 (Trailing 12 Months) is fixed and considers the most recent twelve months, while LLM (Last Twelve Months) is a static period, potentially missing recent market changes.

